We had the opportunity to work with some really great clients and produce some really stellar infographics in 2012. Here’s a recap of our top ten infographics from the past year based on Lemonly page views. Enjoy!
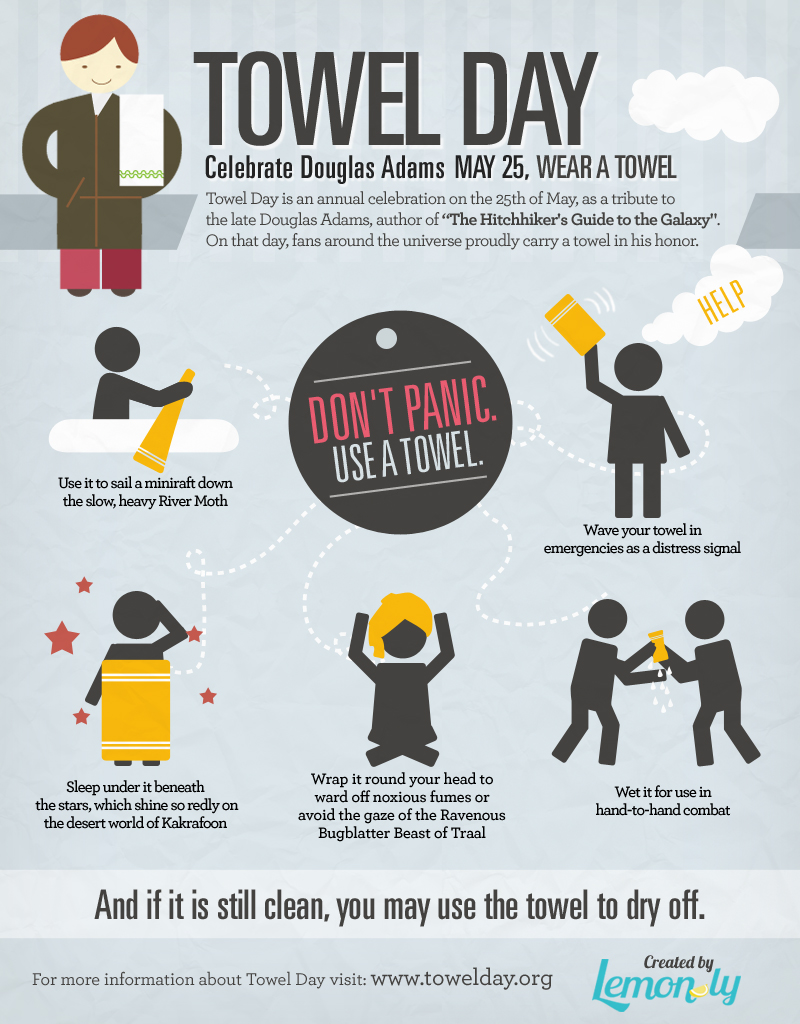
Lemonly designer, Ana, is a HUGE Douglas Adams fan, and if you don’t know much about Douglas Adams, the most important thing to know is that he wrote humorous and fun science fiction books. May marked the 11-year anniversary of Adams’ death. Two weeks after his death, his fans decided to commemorate him by making May 25th, Towel Day.
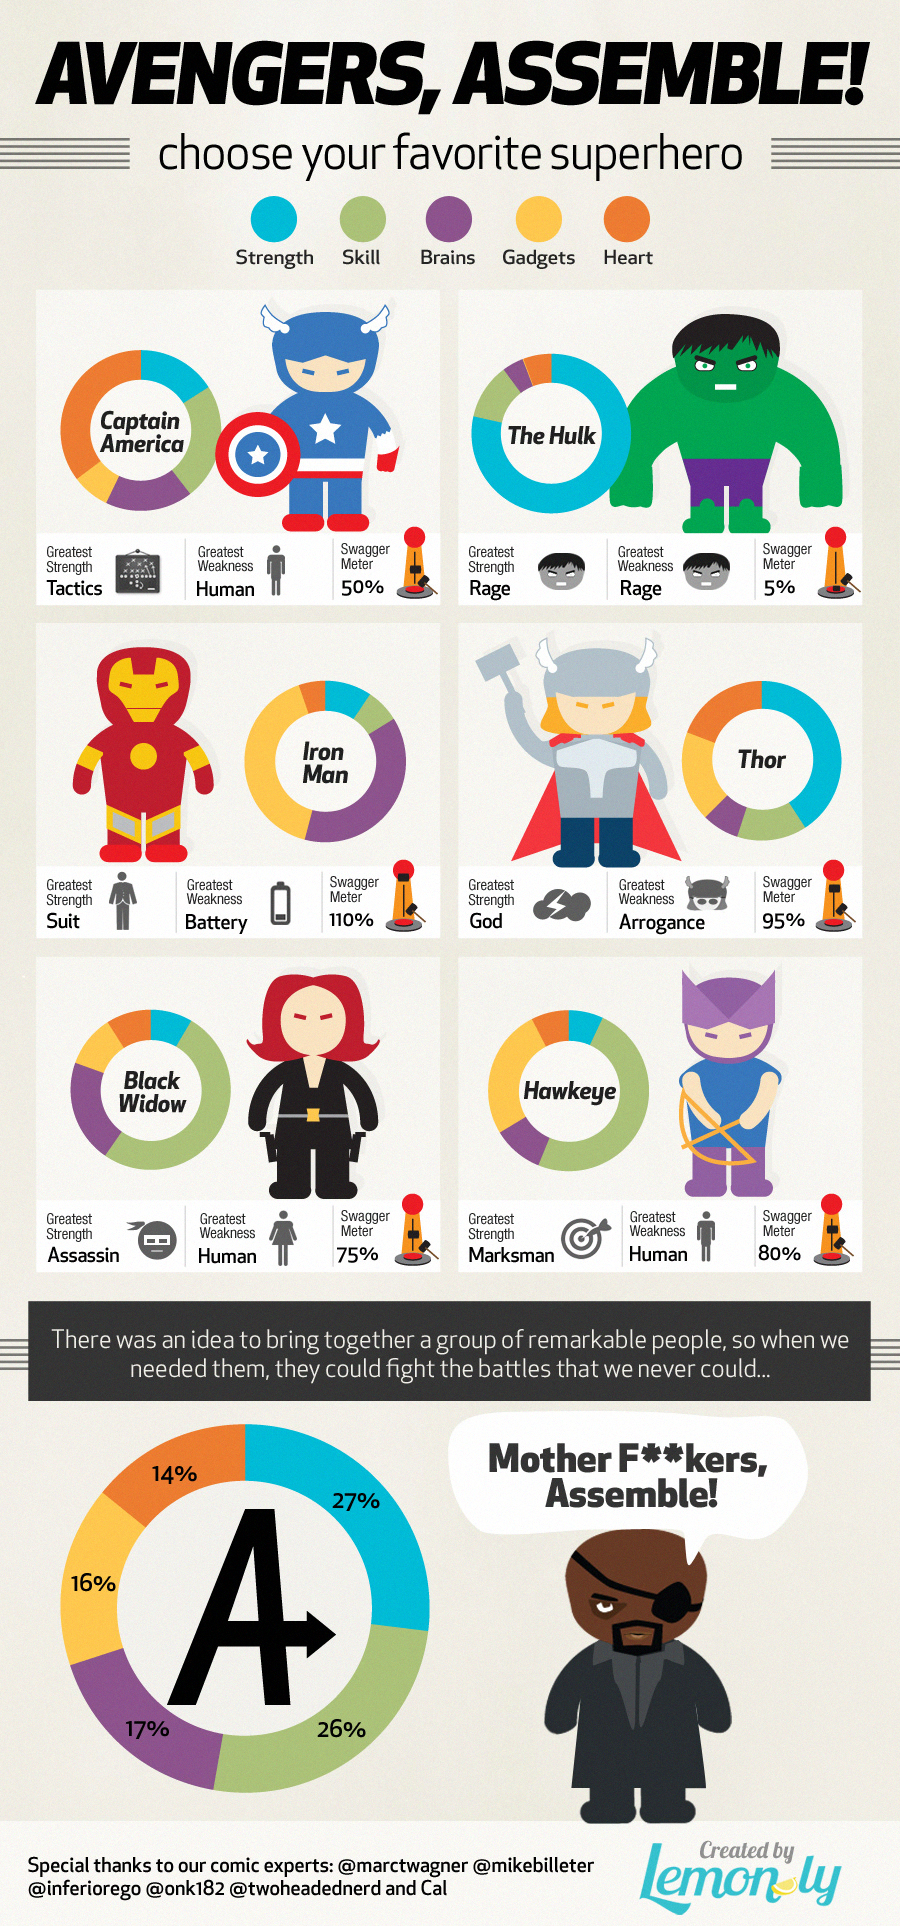
The Lemonly team is a diverse team. We have some Potterheads, Twihards, Trekkies, and I guess Avengaholics on the team and we love to have fun. In honor of the release of the “first big blockbuster of the summer,” The Avengers, we asked Twitter to rank the six avengers across five different superhero categories and this is what we came up with…
 3. Have an interest in Pinterest? (February)
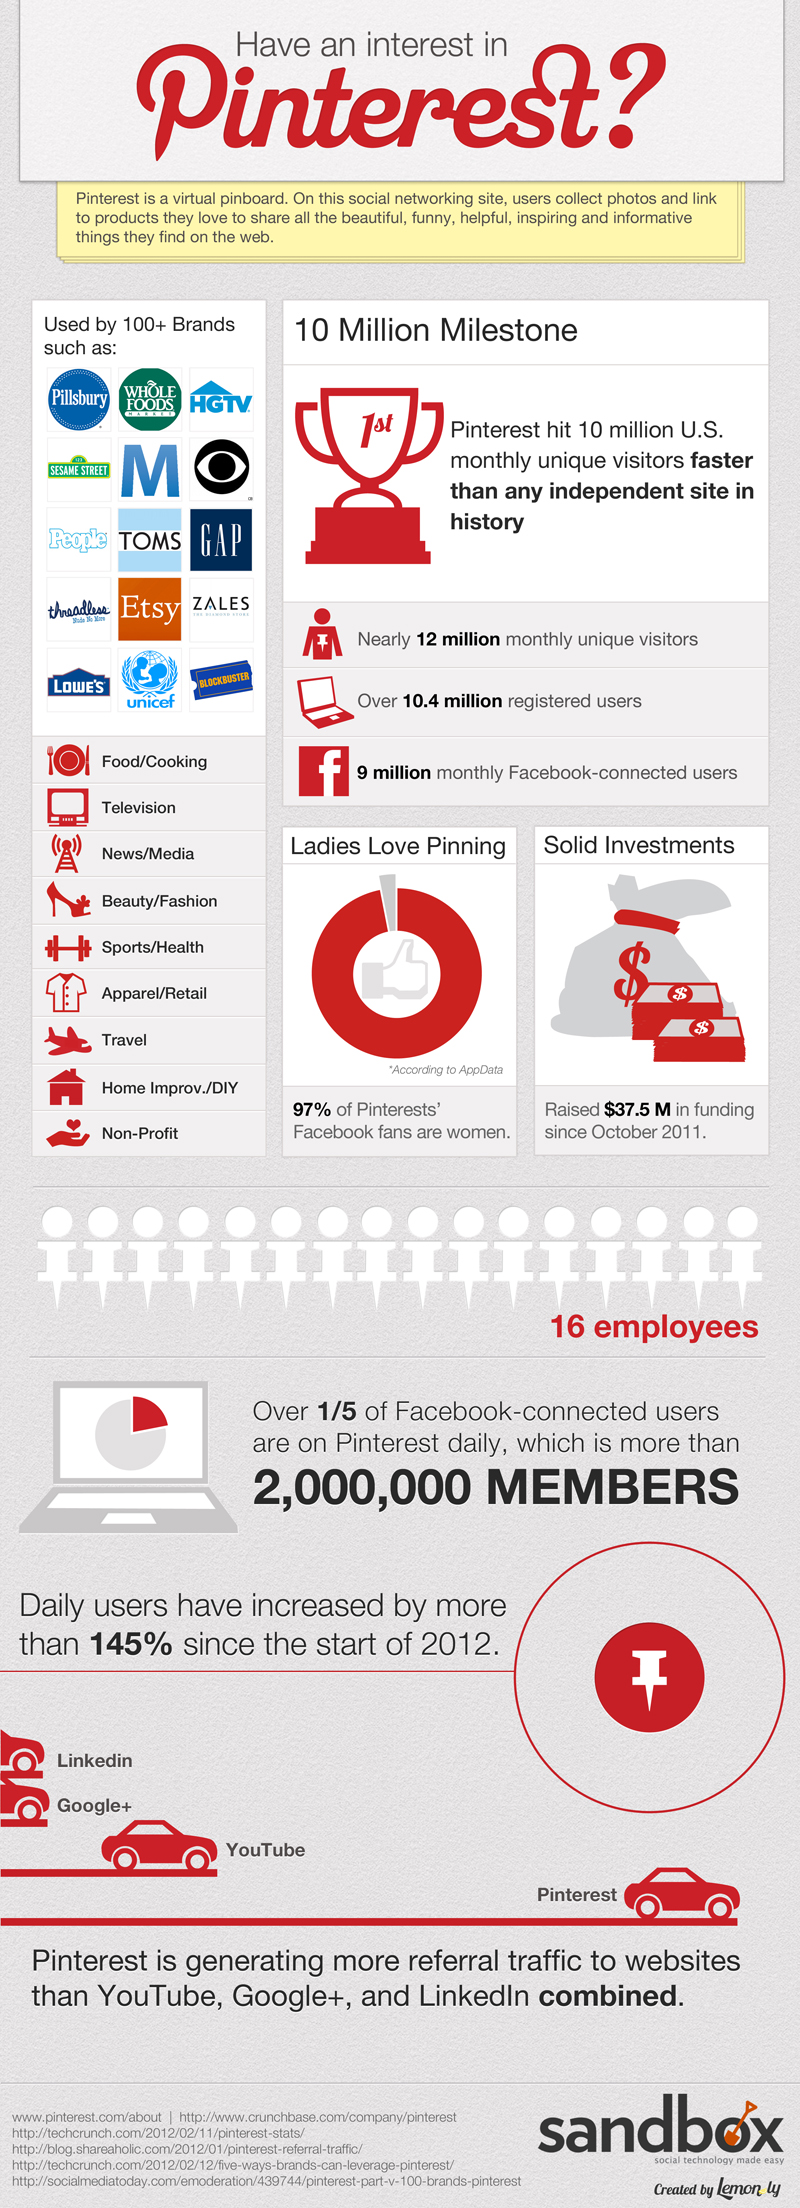
So who hasn’t wasted an entire afternoon on the hottest new social networking site, Pinterest? In case you haven’t, we went ahead and created an infographic that will spark your interest in Pinterest.
4. Building Billion Dollar Brands (February)
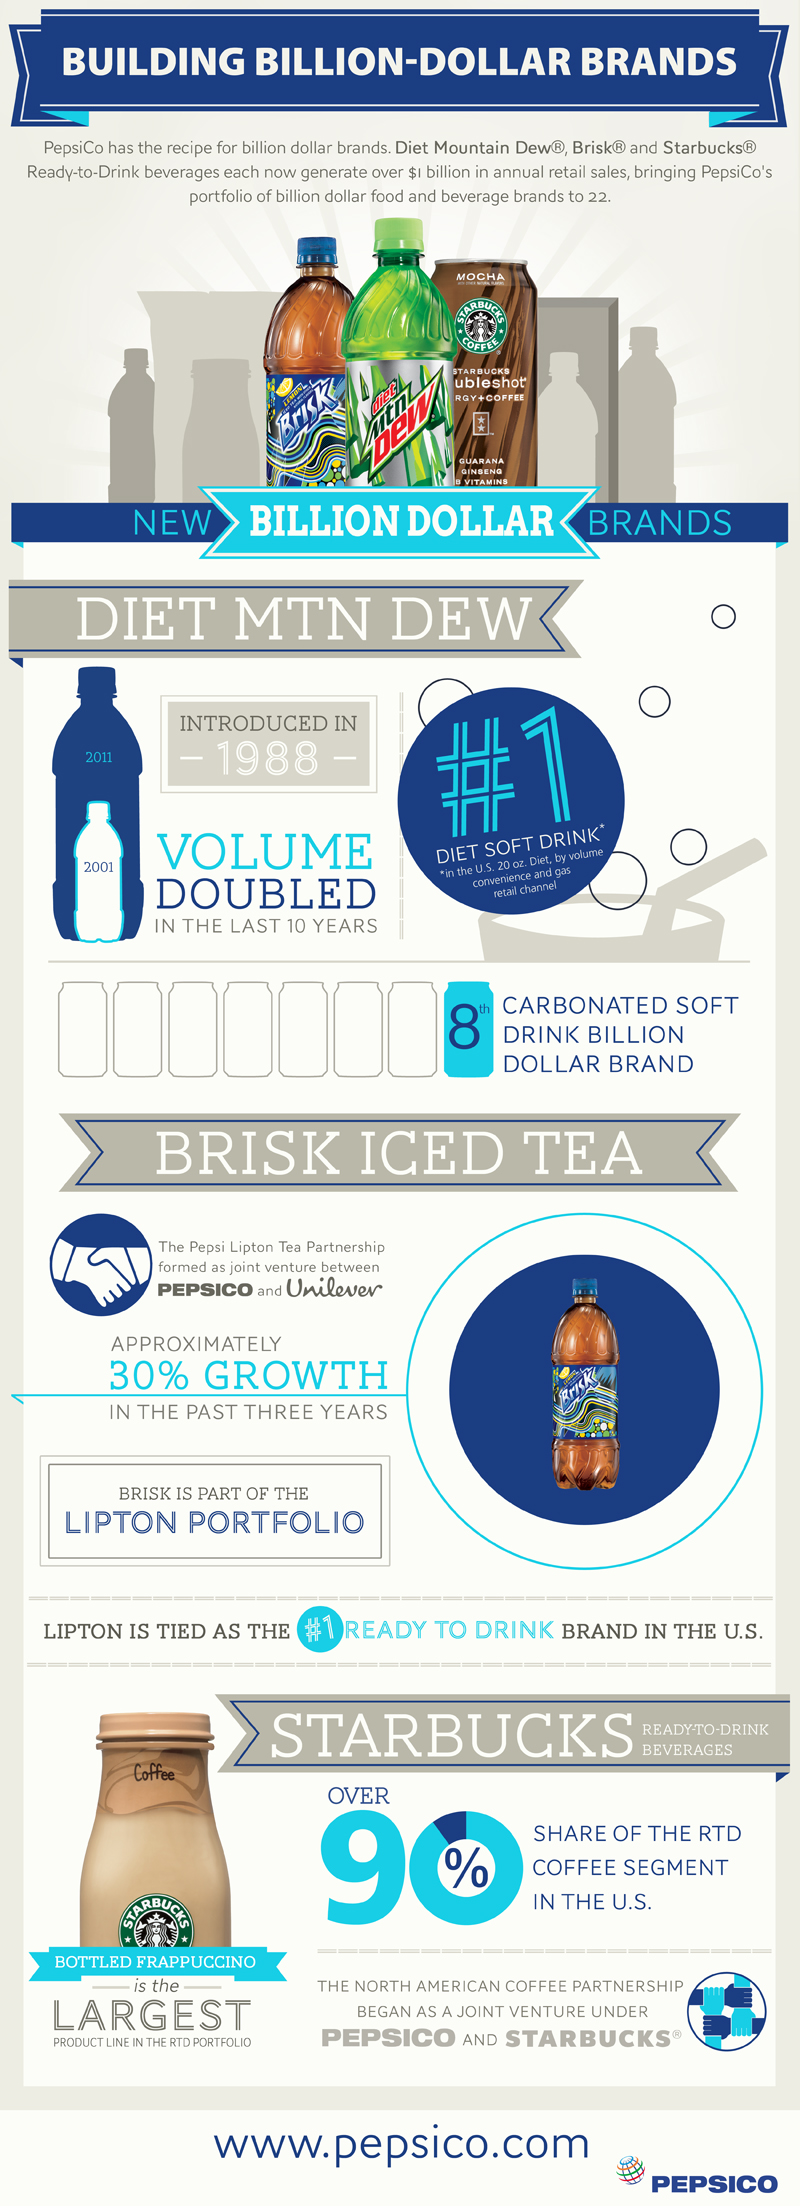
We partnered with Pepsico to take a look at their billion dollar brands. Did you know they now have a portfolio of 22 billion dollar brands?!
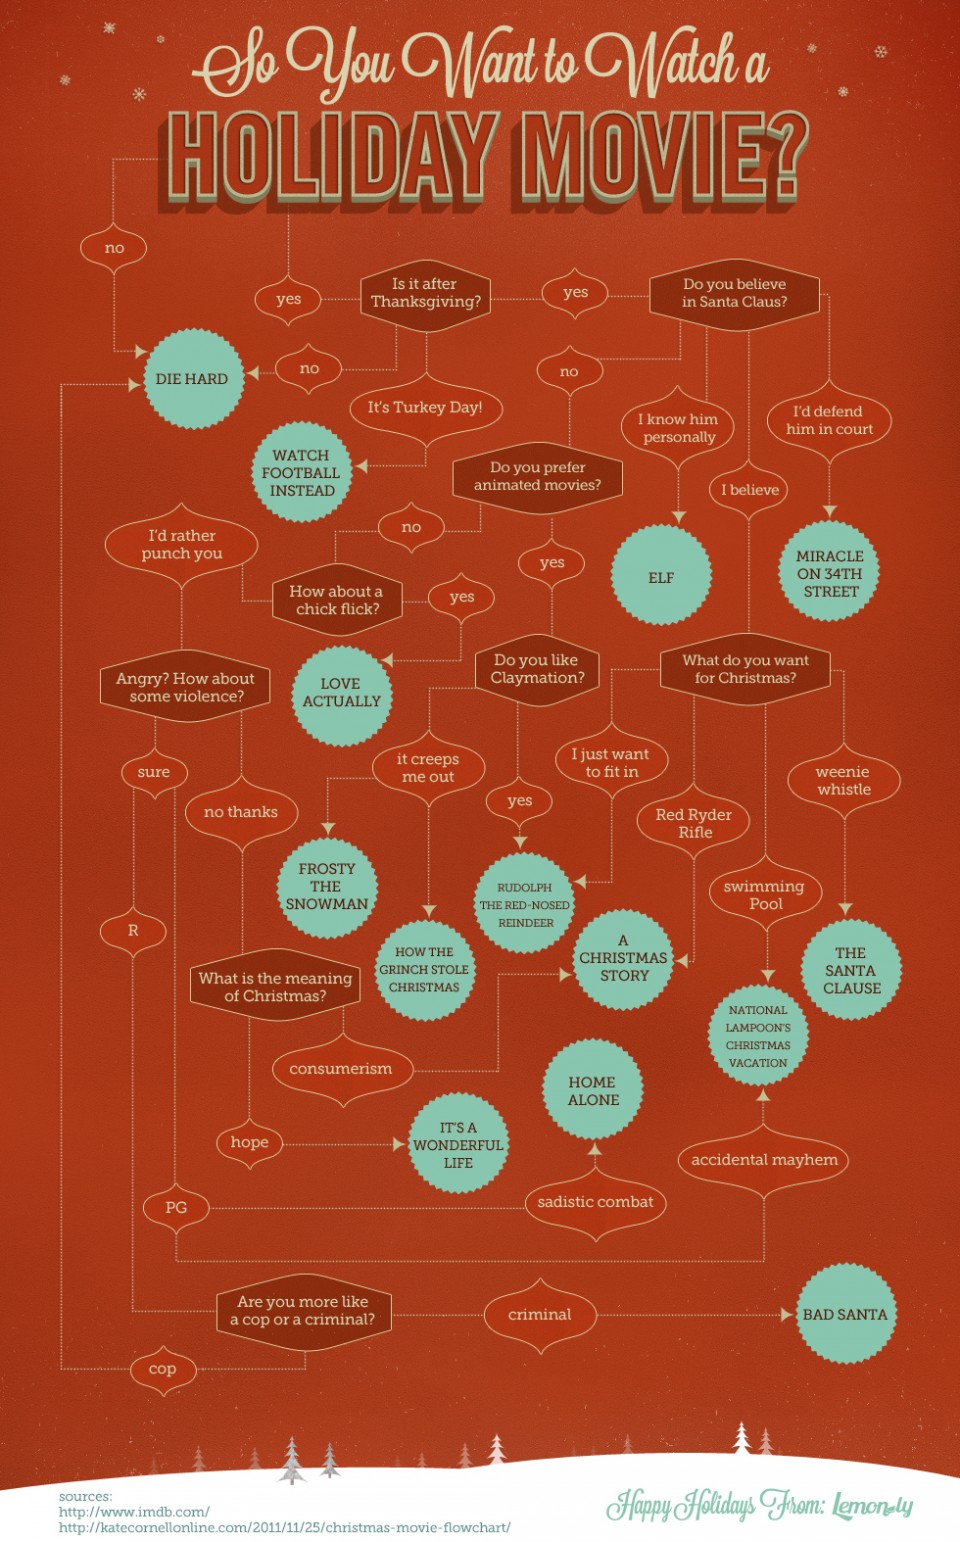 5. Holiday Movie Flowchart (December)
The Huffington Post helped this handy dandy flowchart come in at #5 on our top 10 list. If you’re ever in doubt on which holiday movie is right for you, just follow this holiday movie guide.
 6. South Dakota Facebook Brands (August)
We took a look at the top South Dakota brands on Facebook based on popularity. Did your favorites make the cut?
 7. Insights from 5 Million Emails (February)
Infographic #7 analyzes the best times to send emails, the worst words to use in email titles, and three ways to master email. It gained so much popularity that it was featured on Mashable!
Not only has Shark Week been around for 25 years, but it has been one of Discovery Channel’s most popular programs and now it’s one of our most popular infographics of 2012. We just wish this infographic would have 30 million views…just like the television series.
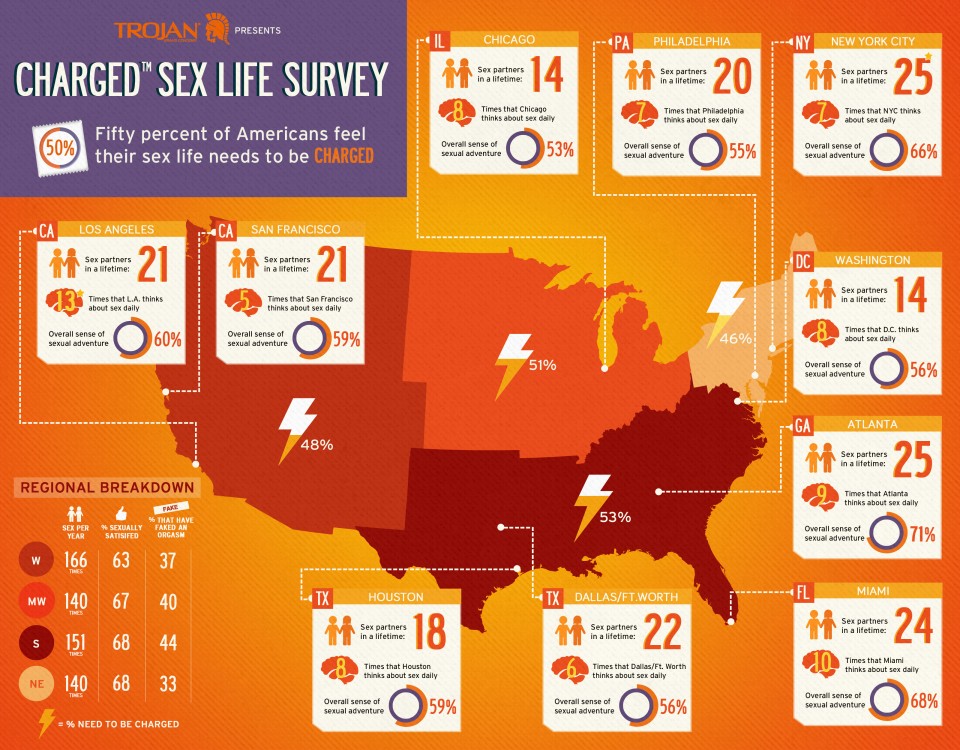 9. Charged Sex Life Survey – Map (July)
We partnered with Trojan for a steamy infographic based on a report conducted on the sex life of Americans. 50% of Americans feel their sex life needs to be charged – do you agree?
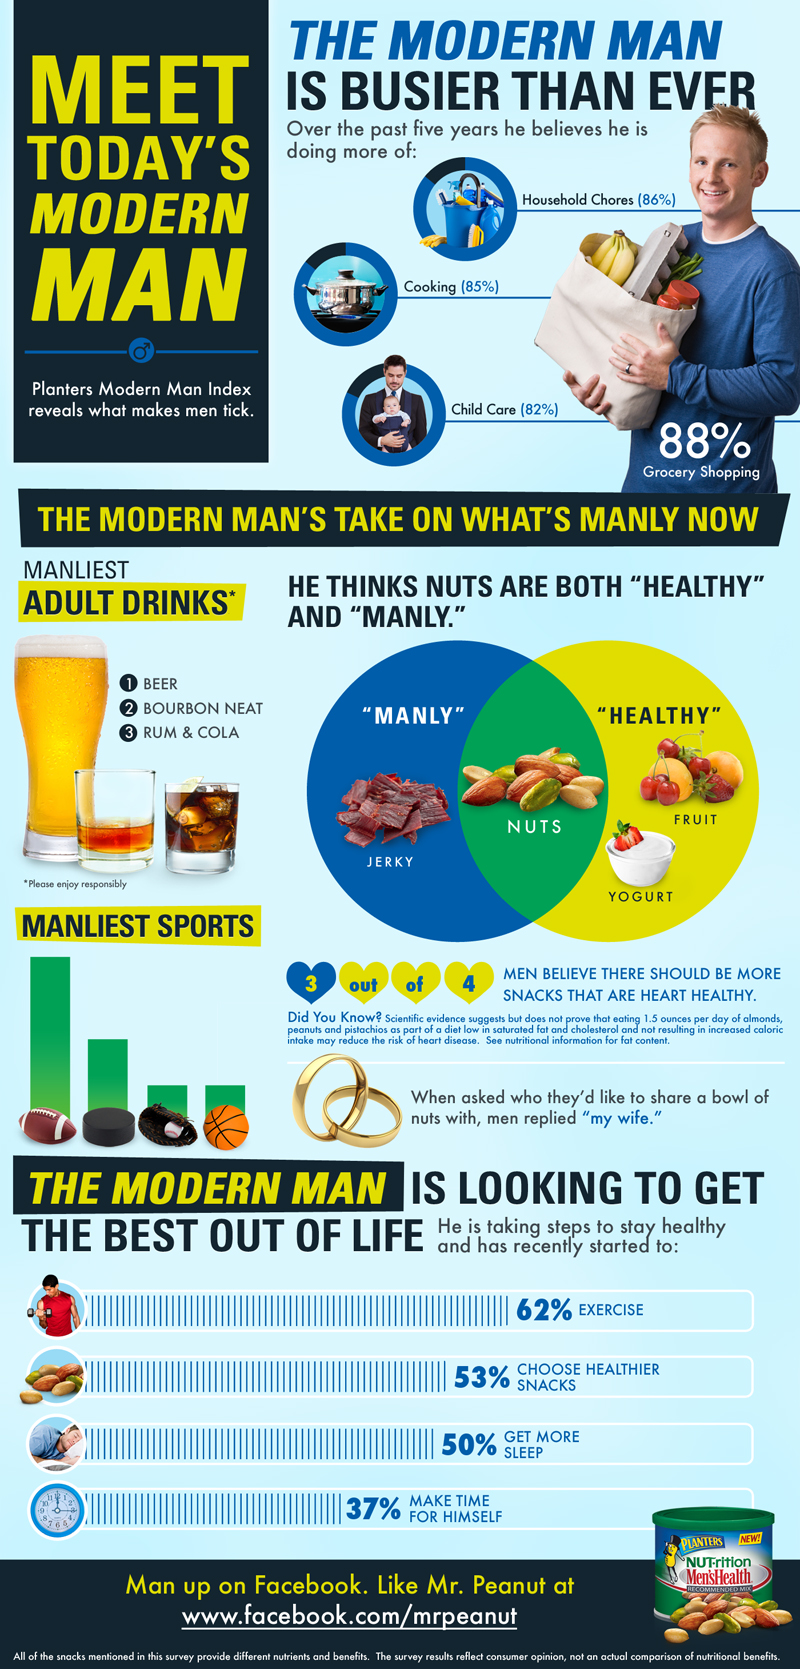 10. Meet Today’s Modern Man (April)
Did you know that today’s modern man BELIEVES that over the past five years he’s been doing more household chores, cooking and child care? Women, what do you think?

