A data visualization of 2012 at Lemonly
It’s official. The 2012 Lemonly Annual Report is hot off the press! We’re pretty stoked to release it to the public. Many Friday afternoons and Jimmy John sammys have gone into this bad boy. Finally the brainstorming, researching and designing have come to an end, and we couldn’t be happier with the results.
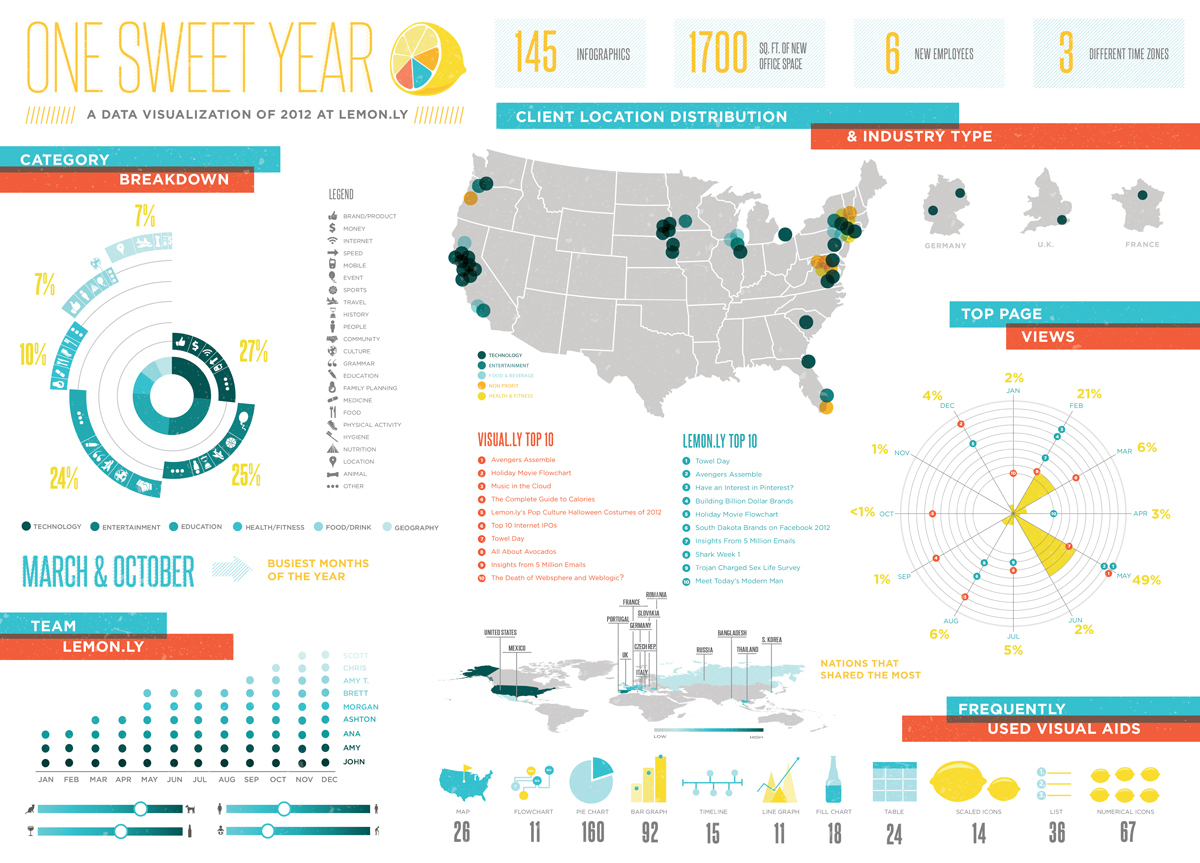
2012 was a sweet year for Lemonly. We created 145 infographics, moved into a 1700 sq. ft new office space, and added 6 new employees – located in 3 different time zones!
Let’s take a look at the details.
As you can see above, we created more technology-focused graphics than any other in 2012, followed by entertainment and education infographics. Our busiest months were March and October, creating record sales.
Lemon.ly clients are scattered across the U.S, Germany, United Kingdom and even France. The majority of our clients populate the coasts and once again the technology and entertainment industries remain popular in the infographic world.
Out of our 145 infographics this year, we definitely had our favorites and so did our fans. Displayed above are the top 10 viewed infographics on Visual.ly and Lemonly.com. Graphics such as the Holiday Movie Flowchart were even picked up and shared by the Huffington Post.
Speaking of shares, it appears that the majority of our fans are in the United States and the United Kingdom, but we have a lot of fans sharing our work across the globe. Thailand, S. Korea, France, Romania, Italy, Russia and Mexico seem to be pretty excited about our sweet visuals as well.
Our Lemon.ly designers were quite busy this year creating timelines, fill charts, and numerical icons. The graph above takes a look at how many of each visual aid we created over the past 12 months. Pie charts and bar graphs remain the most popular and easily digested diagram.
Team Lemonly had an exciting year with six new hires! Ashton, Morgan, Brett, Amy Jo, Chris and Scott all joined the gang, now representing three different time zones. We’re a diverse group of individuals – never a dull day in the office.
For the full visualization, here is the Lemonly Infographics Annual Report!