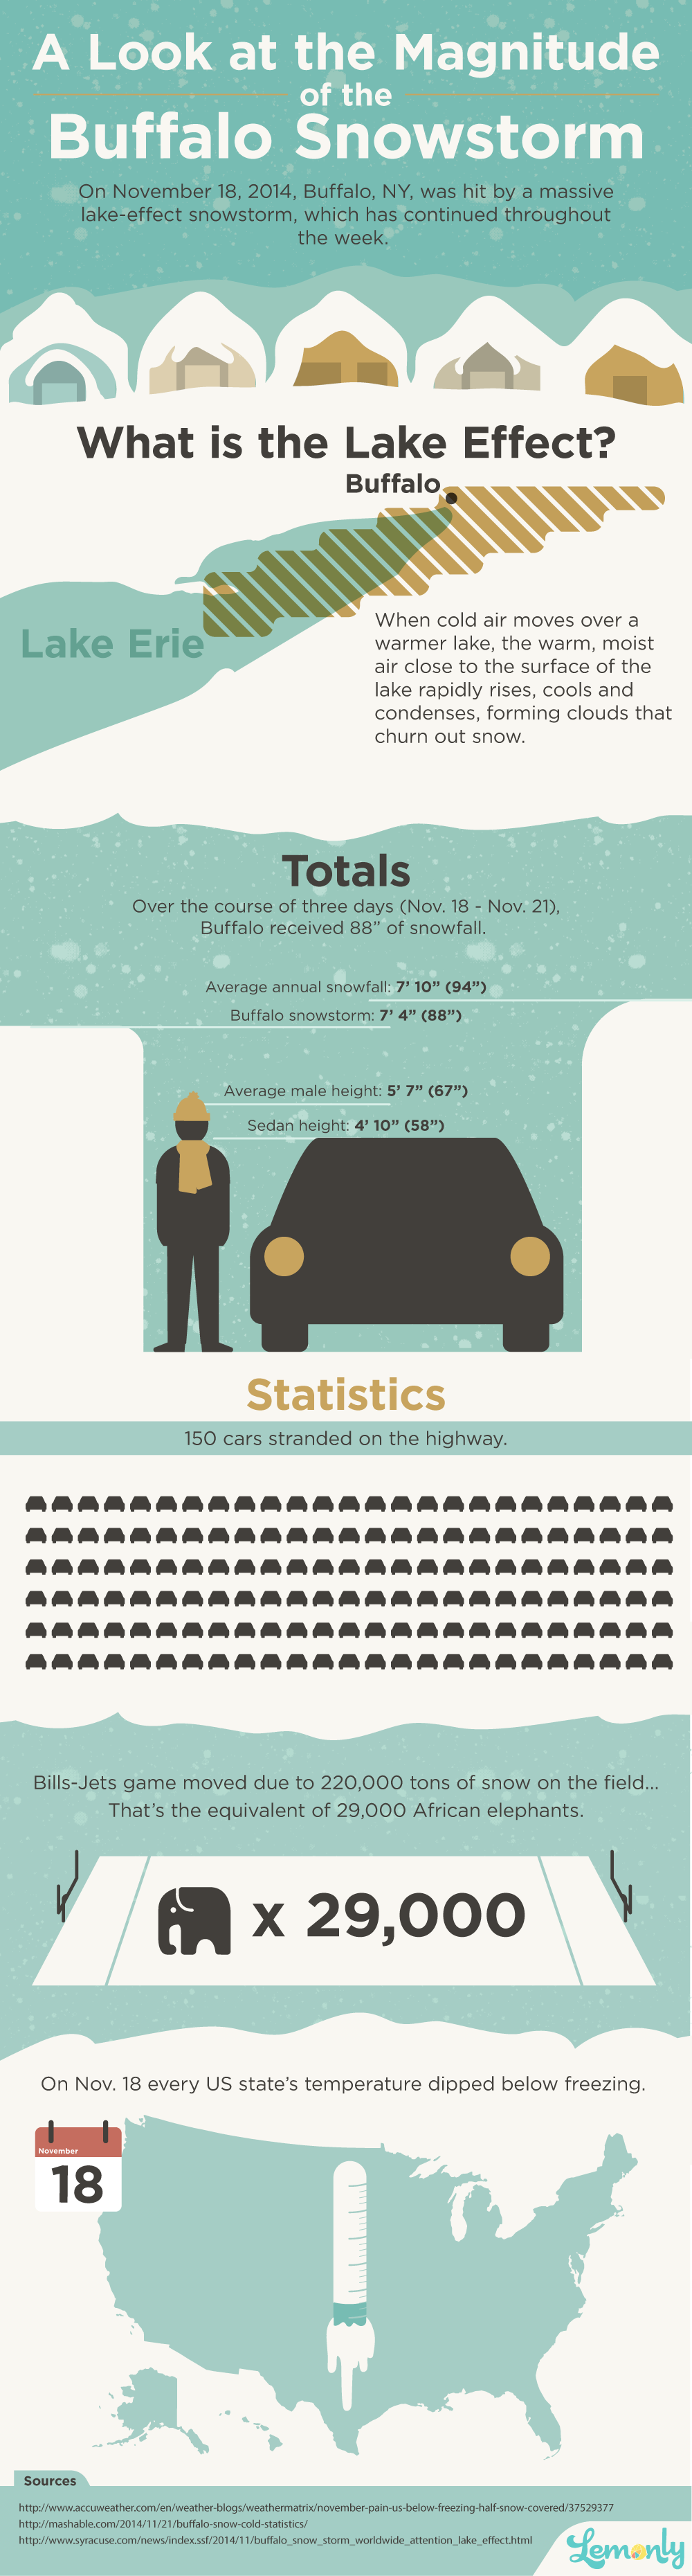
Snowfall in Buffalo, NY, broke records last week with the city getting more snow in two days than it typically does in a year.
We wanted to dive in a bit deeper and look into the stats of this tragic storm and learn why this lake-effect snowstorm happened. Since many of us learn best with visual examples, we thought an infographic would be an appropriate way to look at a few of the snowstorm stats at a glance.
Sadly, the damage in the Buffalo area isn’t ending with the snow. The threat of potential flooding remains as temperatures are expected to be around the 60s in the snow-covered area, forcing it to melt quickly. Thankfully, fears of disastrous flooding from the rapid meltdown eased on Monday, but high winds became a menace, threatening to knock down trees and power lines.
Our thoughts are definitely with those affected by the storm. If you’d like to help out, you can make a donation to the American Red Cross for disaster relief efforts here and here.
To learn even more about the storm, check out our sources:
