Chapter 2
What are interactive infographics?
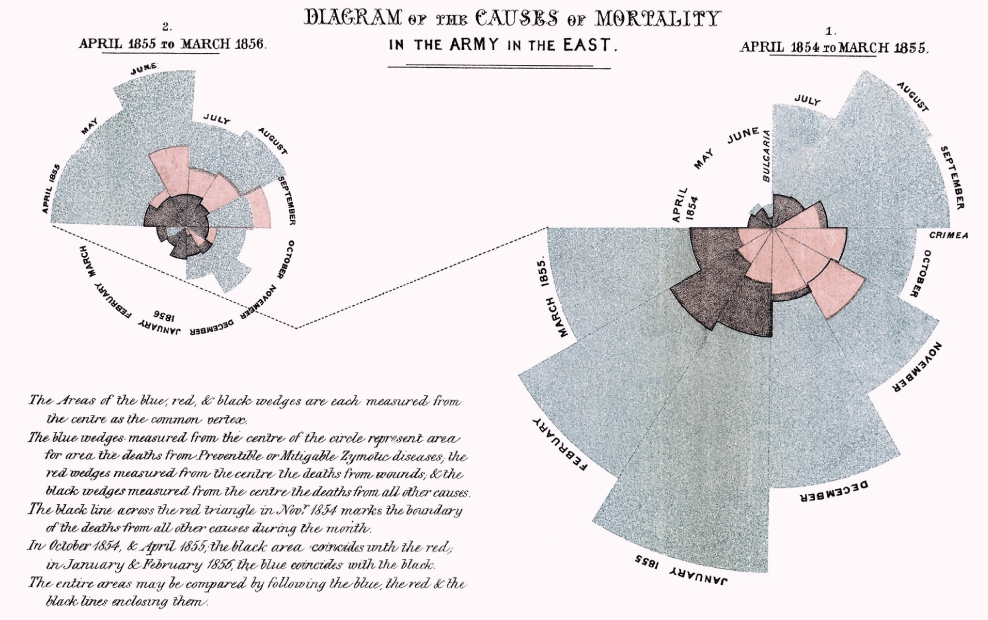
To better its legibility, information has been visualized for hundreds of years. From William Playfair’s invention of the pie chart in the early 1800s to Florence Nightingale’s 1857 infographics that led Queen Victoria to improve the conditions of military hospitals (see below), early examples still provide the bedrock upon which modern, digitally produced and manipulated infographics sit.

Concise text, precise design and logical graphics assemble to make better sense of raw data. Simple as that. With the internet, we can add interactivity to what once were unchanging representations of information. We can hide and show sections when needed, we can animate pieces naturally as a reader scrolls down, and we can ensure relevancy by automatically updating the data included.