In spirit of the NCAA Championship Game tonight, we thought it was appropriate to take a look at a few of our favorite Elite 8 basketball infographics. The eight infographics below (with one even created by us) break down the deets of March Madness, basketball history, and even cheerleaders. Let’s take a visual look at this American pastime.
Did you know there’s over 147 QUINTILLION possibilities in the outcome of a March Madness bracket? Good luck with that…
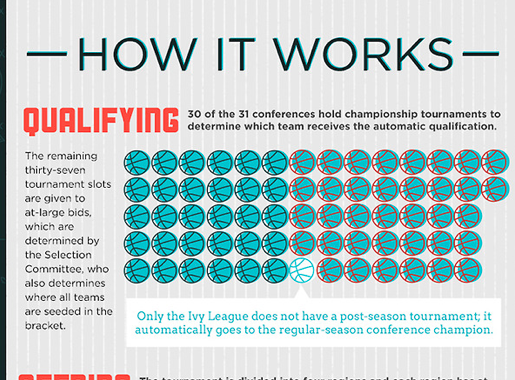
This Statographic will educate you on everything you need to know to act like a NCAA men’s basketball pro.
This year marked the 75th year since the start of the Big Dance – that’s a lot of dancing. Read up on your March Madness history with this slam dunk infographic from TicketCity.
Once Upon a Time There was…The Madness…in March

The Games! The Upsets! The Madness! Get lost in the Cinderella story of this year’s March Madness Tournament.
The Championships Ring: NBA 1947 – 2012
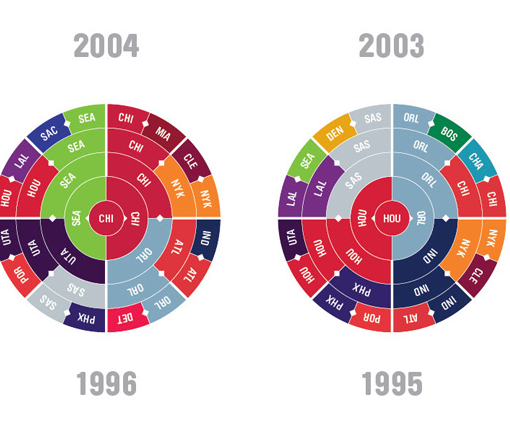
This is a great visual of the history of every NBA playoff series from 1947-2012. That’s a lot of basketball!
Seat Geek’s Guide to the Final Four
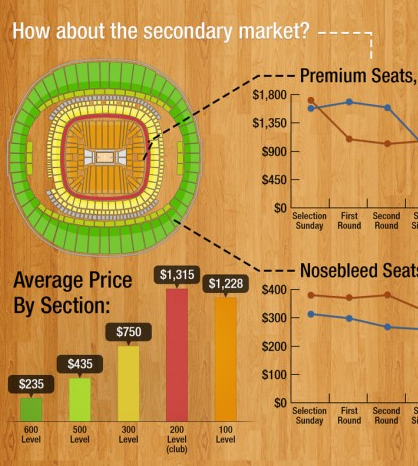
How much does it REALLY cost to go to the Big Dance? Got $5,775? Ya, me either..but that doesn’t mean you have to miss this price breakdown of the Final Four!
All NBA field goal attempts. 2006-2011
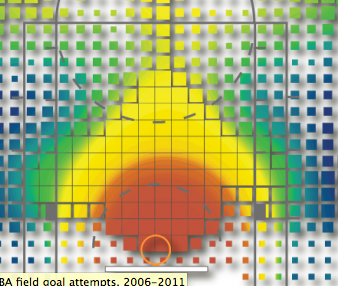
Woah DATA! Check out this spatial field goal database that included Cartesian coordinates (x,y) for every field goal attempted over a 5-year period. This data set includes player name, shot location, and shot outcome for over 700,000 field goal attempts.
Cheerleaders Fly High and So Do Their Risks
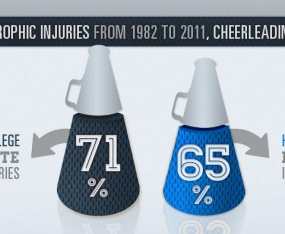
In the midst of all this basketball hype – we couldn’t forget the cheerleaders. Go Team Go!
US Basketball Participation – Including March Madness
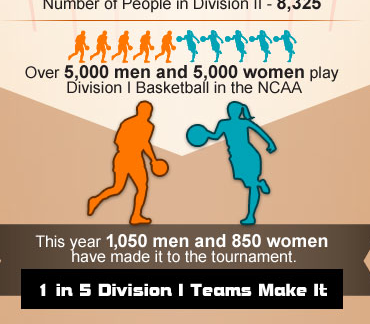
Last year a combined total of 868 million viewers watched the NCAA tournaments. The men’s final game alone drew 20.1 million viewers. Interested in more odd NCAA tournament facts? Then read up on this IG.
With all this new knowledge, you should feel pretty confident going into tonight’s game. Help us predict the outcome! Who are you rooting for?
